I feel like an idiot for asking, but . . where exactly do I access this, once it is installed? I've been using OBS for years as well as numerous plugins, but for some reason I can't seem to find out where these settings or the source or whatever I need to activate it is hiding...?
You are using an out of date browser. It may not display this or other websites correctly.
You should upgrade or use an alternative browser.
You should upgrade or use an alternative browser.
spectralizer v1.3.4
- Thread starter univrsal
- Start date
univrsal
Active Member
If you installed it correctly it should show up with all the other sources. If it doesn't I need a full log to help youI feel like an idiot for asking, but . . where exactly do I access this, once it is installed? I've been using OBS for years as well as numerous plugins, but for some reason I can't seem to find out where these settings or the source or whatever I need to activate it is hiding...?
Attachments
Fire_Punch
New Member
Yes it does, did you install it correctly? I need a log to help you
I followed your instructions and also tried making it's own folder within my obs-plugins folder as well as pasting in the contents into the corresponding folders that already existed in OBS. Nothing showing up under Tools when I launch.
Attachments
univrsal
Active Member
The log doesn't contain any trace of an attempt to load the plugin which leads me to believe, that you didn't install it correctly. Also this plugin does not add anything to the Tools menu so obviously there won't be anything there.I followed your instructions and also tried making it's own folder within my obs-plugins folder as well as pasting in the contents into the corresponding folders that already existed in OBS. Nothing showing up under Tools when I launch.
Fire_Punch
New Member
This should be the same but I found and successfully added the source into OBS instead of looking for it in tools like a dummy. No changes to where the files were located.The log doesn't contain any trace of an attempt to load the plugin which leads me to believe, that you didn't install it correctly. Also this plugin does not add anything to the Tools menu so obviously there won't be anything there.
Attachments
univrsal
Active Member
Hmm yeah apparently I overlooked something. It says 'spectralizer.dll' in both. Well you still didn't install the language files correctly though as it says that they're missingThis should be the same but I found and successfully added the source into OBS instead of looking for it in tools like a dummy. No changes to where the files were located.
Thanks, love this plug-in and also the Scrab plugin. Not sure if this is the problem others are having with getting it to work, but it tripped me up at first so sharing in case it is! The ReadMe file states for Windows users the installation process is:
1. Extract the archive
2. Move the folder obs-plugins and data into your obs installation directory
It really IS that simple, but a not-very-techy streamer, keen to not mess things up, might over-complicate it because when you go to the obs-studio folder (usually C:drive Program files: obs-studio) you find that folders called obs-plugins and data already exist (alongside the bin folder).
Don't worry, you're in the right place! Open your extracted spectralizer.v1.1b.win32.64 folder in another window, double-click on the plug-in folder and you'll come to the two spectralizer folders called data and obs-plugins. Select, then move them to that main obs-studio folder. It won't completely replace the obs-plugins and data folders already there (or create data(1) and obs-plugins(1) folders or something), it will simply write the new files as required for spectralizer in the correct place within the existing data and obs-plugins folders.
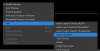
Then open up OBS, click the + sign in Sources and you'll find Audio Visualizer is now an option to choose.
Very obvious to most people, I guess, but seeing that those folders already existed in obs-studio made me worry that I might need to drill further down (either in obs-studio or in what I copied across from the extracted spectralizer folder).
1. Extract the archive
2. Move the folder obs-plugins and data into your obs installation directory
It really IS that simple, but a not-very-techy streamer, keen to not mess things up, might over-complicate it because when you go to the obs-studio folder (usually C:drive Program files: obs-studio) you find that folders called obs-plugins and data already exist (alongside the bin folder).
Don't worry, you're in the right place! Open your extracted spectralizer.v1.1b.win32.64 folder in another window, double-click on the plug-in folder and you'll come to the two spectralizer folders called data and obs-plugins. Select, then move them to that main obs-studio folder. It won't completely replace the obs-plugins and data folders already there (or create data(1) and obs-plugins(1) folders or something), it will simply write the new files as required for spectralizer in the correct place within the existing data and obs-plugins folders.
Then open up OBS, click the + sign in Sources and you'll find Audio Visualizer is now an option to choose.
Very obvious to most people, I guess, but seeing that those folders already existed in obs-studio made me worry that I might need to drill further down (either in obs-studio or in what I copied across from the extracted spectralizer folder).
univrsal
Active Member
Have you read and followed the installation instructions carefully?hi i seem to be having trouble with this addon.
i have downloaded the zip file i then added it to the add-on folder nothing happens in obs
novelscale
New Member
Any plans to add different visualizers preset ?
thanks for the plugin, working fllawlessly in windows 10 using my focusrite as input
thanks for the plugin, working fllawlessly in windows 10 using my focusrite as input
univrsal
Active Member
What do you mean by different visualizer presets? If you're thinking about something like thisAny plans to add different visualizers preset ?
thanks for the plugin, working fllawlessly in windows 10 using my focusrite as input
BlazingBlackBeard
New Member
Can we have a more pleasing filter for the audio spectrum, like Lano visualiser for Rainmeeter? The current filter is too harsh and fills most of the height in the spectrum with very little acoustic amplitude. Lano however has a nice bouncy looking spectrum, only responding to the peaks of amplitude and appearing to disregard the rumble. It's working exponentially it seems, rather than responding linearly with amplitude.
I was hoping to stop capturing my desktop and Rainmeeter Lano and replace functionality with this tidy plugin, but for now it is not suitable and just produces a busy and unappealing looking spectrum (it might be more scientifically accurate but were not looking to represent the entire dynamic range in a linear fashion whilst broadcasting on OBS studio, were looking for visually appealing and bouncy renditions. This plugin doesn't provide that in it's current incarnation.
Also the ability to round off the tips of the frequency bands is missing, something that is just so sweet looking in Rainmeeter Lano. Something that would also be of great benefit is to define outlines to the frequency bands with line width and anti-aliasing settings. This would then cater for everyone including people who have the ability to use more processing power for more pleasing visuals.
Lastly, for this to be a viable alternative to Rainmeeter Lano, it should ideally incorporate the ability to manually select sound resolution to allow for use on a range of hardware, unlimited high resolutions for use with multi-core high end and even Xeon processors and lower resolutions (512 and below equivalent in Lano) for budget systems with Pentium, i3 and i5 processors.
Last edited:
novelscale
New Member
thanks for the reply, I was thinking about something more pleasant to the eye, like the possibility to have different colors for different bars - stupid presets like this, nothing fancy.obs doesn't have any function for drawing lines and I don't want to implement that myself
Something like this
univrsal
Active Member
that should be possible. Just random colors or like a transition from one to another?thanks for the reply, I was thinking about something more pleasant to the eye, like the possibility to have different colors for different bars - stupid presets like this, nothing fancy.
Something like this
univrsal
Active Member
If by "rounding off the tips" you mean rounding the rectangles, that's not possible, because I only have one method of drawing rectangles an as I've stated before I'm not keen on looking into adding new ways of drawing.Can we have a more pleasing filter for the audio spectrum, like Lano visualiser for Rainmeeter? The current filter is too harsh and fills most of the height in the spectrum with very little acoustic amplitude. Lano however has a nice bouncy looking spectrum, only responding to the peaks of amplitude and appearing to disregard the rumble. It's working exponentially it seems, rather than responding linearly with amplitude.
I was hoping to stop capturing my desktop and Rainmeeter Lano and replace functionality with this tidy plugin, but for now it is not suitable and just produces a busy and unappealing looking spectrum (it might be more scientifically accurate but were not looking to represent the entire dynamic range in a linear fashion whilst broadcasting on OBS studio, were looking for visually appealing and bouncy renditions. This plugin doesn't provide that in it's current incarnation.
Also the ability to round off the tips of the frequency bands is missing, something that is just so sweet looking in Rainmeeter Lano. Something that would also be of great benefit is to define outlines to the frequency bands with line width and anti-aliasing settings. This would then cater for everyone including people who have the ability to use more processing power for more pleasing visuals.
Lastly, for this to be a viable alternative to Rainmeeter Lano, it should ideally incorporate the ability to manually select sound resolution to allow for use on a range of hardware, unlimited high resolutions for use with multi-core high end and even Xeon processors and lower resolutions (512 and below equivalent in Lano) for budget systems with Pentium, i3 and i5 processors.
This plugin also already allows for choosing how many bars you want in the visualizer, I don't know what else you would want in terms of "sound resolution". I use FFTW3 for audio processing, which is more than good enough and it uses special instructions to speed up the process.
Lastly I'm looking into the Lano Visualizer, but won't promise anything.
Last edited:
BlazingBlackBeard
New Member
If by "rounding off the tips" you mean rounding the rectangles, that's not possible, because I only have on method of drawing rectangles an as I've stated before I'm not keen on looking into adding new ways of drawing.
That's fine. I was just wondering how to make it look a bit more visually appealing. If it doesn't lend itself to that then it's not a major issue.
This plugin also already allows for choosing how many bars you want in the visualizer, I don't know what else you would want in terms of "sound resolution".
I refer to the Rainmeeter Lano visualiser. It's clear in this plugin that setting "sound resolution" refers to the amplitude and bit depth of the visualisation, not the frequency bands. Using a lower sampling bit depth for display in Lano severely reduces CPU usage. This is what I was referring to, not frequency response.
I use FFTW3 for audio processing, which is more than good enough and it uses special instructions to speed up the process.
I was referring to using the upper amplitude section of the audio waveform, as Lano does, similar to the way an expander would decrease the amplitude of lower amplitude signals and effectively render most movement only in the peaks to make the frequency bands dynamically dance, rather than saturate the display with low amplitude background rumble of the audio track playing and have very little visual appeal.
I was wondering why you have not implemented a simple sensitivity setting, as Lano does in the Rainmeeter visualiser. Not rendering below a certain bit depth threshold (sensitivity) and then remapping the remaining high energy amplitude to fill the bar in a linear fashion is all that's needed.
That or one could also include the option to exponentially represent amplitude instead of representing it in linear fashion, then in addition to threshold sensitivity, one could also give the user another control to allow the linear representation to be transformed into an adjustable representation function. This would allow a user to fine tune a selectable representation, anywhere from an exaggerated and saturated, ugly logarithmic display, to a conservative exponential amplitude display showing a huge amount of fluidity and dynamic movement only in the peaks and they could combine that with a sensitivity threshold to remove the low amplitude rumble completely from display.
Either or both would go a long way to improving the visuals. Both are valid and not particularly computationally expensive.
Lastly I'm looking into the Lano Visualizer, but won't promise anything.
Great. Hopefully I have explained this in a clear manner so that this can easily be attained. Thanks again for the quick reply :-)
I have provided a video comparison here which would be better downloaded as it's not a standard resolution and the Google Drive preview tries to reencode it and fails as it looks awful so just download for a fair comparison. https://drive.google.com/open?id=1qjWAWas2Vu9VsVDjjJw9tFUgb4ccsUWP
univrsal
Active Member
Because I have absolutely no experience with audio processing. The visualizer is entirely based on other existing visualizers, which is also why I don't know whether I can copy over the code from RainmeterI was wondering why you have not implemented a simple sensitivity setting, as Lano does in the Rainmeeter visualiser. Not rendering below a certain bit depth threshold (sensitivity) and then remapping the remaining high energy amplitude to fill the bar in a linear fashion is all that's needed.
BlazingBlackBeard
New Member
Because I have absolutely no experience with audio processing. The visualizer is entirely based on other existing visualizers, which is also why I don't know whether I can copy over the code from Rainmeter
You appear to be representing the frequency bands in a linear fashion (this is not related to the above post which is about amplitude sensitivity), but it is an accepted industry standard to represent spectral audio feedback in a logarithmic fashion.
There is an important reason why the industry adheres to this standard. It's for the uniformity of the display of coherent frequencies, rather than wasting bands on high frequency content that most people find irrelevant when listening to music, as the bulk of dynamics falls in the relatively low frequency part of the audio spectrum between 30 Hz and 6 KHz.
For this to make sense and to be easily readable, logarithmic scales are implemented on all peices of audio equipment and audio software that have frequency band visualisation. Even the archaic graphic equalisers of stacking stereo systems had sliders placed in logarithmic positions to control each frequency band. The audio content that you want to be representing is the relatively low frequency dynamic coherent content, so it makes sense to use a logarithmic scale for the visual representation in your plugin.
Think of using a linear frequency scale as the equivalent of watching a high dynamic range (HDR) movie on an standard dynamic range (SDR) screen. With a linear audio frequency visualisation one can only see a compressed version of the frequencies that can be readily heard and easily isolated in the lower range, but the higher frequency content would be dominating most of the visualisation. This is akin to the brightest scene with lots of contrast in an HDR movie being viewed on an SDR screen which will still render a full picture with all the content, but the brighter parts will be compressed, making the brighter parts of the image mingle together with the medium parts and make it look relatively flat, washed out and drab. This is exactly what's happening to the lower frequencies on your audio visualiser using a linear representation scale for frequency, because the most dynamic parts in the lower frequencies are squashed into a very small space at the beginning of graph.
Now think of using a logarithmic scale as the equivalent of watching an HDR movie on an HDR screen. With logarithmic audio visualisation one can see all of the expanded lower frequency dynamic content spread across more of the visualisation and the higher frequency content is relegated to the end, compressed up against the last third or so of the visualisation. This makes more room for coherent dynamic content and compresses the higher and mostly incoherent frequencies at the top, wasting less space by not representing what is essentially a noise wall in the higher frequencies.
The relationship between frequency bands is halved for every unit of length along the X axis. That means if you represent 1KHz at point 0, equispaced point 1 must be 2 KHz, equispaced point 3 must be 4KHz, so on and so forth. The same goes for any frequencies in between, representing in a logarithmic way, otherwise the bulk of your dynamic content will display as shown in my comparison video, with most of the movement happening in the lower quarter of your range and the other three quarters taken up by high frequency noise that represents visually as a thick block of pretty much nothing.
Fix that and I think you'll be half way there to removing the unsightly block of unnecessary noise from most of the graphic representation, essentially compressing it into the last quarter of your x axis. Much nicer. :-)
Last edited:
univrsal
Active Member
Someone else already commented on the scale issue. I dug around in the code and found this. If the comment is correct, then the visualizer is currently doing the exact opposite and boosts high frequencies. But once again I have no idea how any of that works. I know what a logarithmic scale is and why it might be more useful, but I still don't know how to in cooperate that into the existing code.You appear to be representing the frequency bands in a linear fashion (this is not related to the above post which is about amplitude sensitivity), but it is an accepted industry standard to represent spectral audio feedback in a logarithmic fashion.
There is an important reason why the industry adheres to this standard. It's for the uniformity of the display of coherent frequencies, rather than wasting bands on high frequency content that most people find irrelevant when listening to music, as the bulk of dynamics falls in the relatively low frequency part of the audio spectrum between 30 Hz and 6 KHz.
For this to make sense and to be easily readable, logarithmic scales are implemented on all peices of audio equipment and audio software that have frequency band visualisation. Even the archaic graphic equalisers of stacking stereo systems had sliders placed in logarithmic positions to control each frequency band. The audio content that you want to be representing is the relatively low frequency dynamic coherent content, so it makes sense to use a logarithmic scale for the visual representation in your plugin.
Think of using a linear frequency scale as the equivalent of watching a high dynamic range (HDR) movie on an standard dynamic range (SDR) screen. With a linear audio frequency visualisation one can only see a compressed version of the frequencies that can be readily heard and easily isolated in the lower range, but the higher frequency content would be dominating most of the visualisation. This is akin to the brightest scene with lots of contrast in an HDR movie being viewed on an SDR screen which will still render a full picture with all the content, but the brighter parts will be compressed, making the brighter parts of the image mingle together with the medium parts and make it look relatively flat, washed out and drab. This is exactly what's happening to the lower frequencies on your audio visualiser using a linear representation scale for frequency, because the most dynamic parts in the lower frequencies are squashed into a very small space at the beginning of graph.
Now think of using a logarithmic scale as the equivalent of watching an HDR movie on an HDR screen. With logarithmic audio visualisation one can see all of the expanded lower frequency dynamic content spread across more of the visualisation and the higher frequency content is relegated to the end, compressed up against the last third or so of the visualisation. This makes more room for coherent dynamic content and compresses the higher and mostly incoherent frequencies at the top, wasting less space by not representing what is essentially a noise wall in the higher frequencies.
The relationship between frequency bands is halved for every unit of length along the X axis. That means if you represent 1KHz at point 0, equispaced point 1 must be 2 KHz, equispaced point 3 must be 4KHz, so on and so forth. The same goes for any frequencies in between, representing in a logarithmic way, otherwise the bulk of your dynamic content will display as shown in my comparison video, with most of the movement happening in the lower quarter of your range and the other three quarters taken up by high frequency noise that represents visually as a thick block of pretty much nothing.
Fix that and I think you'll be half way there to removing the unsightly block of unnecessary noise from most of the graphic representation, essentially compressing it into the last quarter of your x axis. Much nicer. :-)
novelscale
New Member
For some reason I get those empty bars on the right, with default settings. what is it ?
