Question / Help FPS dip while streaming with FX8350 (resolved)

BananaMan396

New Member
Hello there. I am streaming and I am experiencing problems to where at random points when I am streaming, my fps drops from around 100 fps to around ~10 fps, making the game unplayable. Then after around 10 seconds or so, my fps is back to normal. It doesn't happen alot but happens occasionally and is annoying when it does. What could be causing this?

Computer Specs:
Windows 8.1 Pro
AMD 8350 8 Core 4.0 GHz
Gigabyte R9 280x 3072MB GDDR5
8 gigs of Ram
7200 RPM 1 TB Hard Drive


Internet Speed:
http://www.speedtest.net/result/3431402642.png

OBS Settings:

http://i.gyazo.com/52af053859e090a7aea7682328a908b2.png

http://i.gyazo.com/a7951b79c9c09e63bca47f2a78fc2a0c.png

http://i.gyazo.com/3a9838ac451e1ba2ad5180b8467408a5.png

Code:
Log:
16:34:07: =====Stream Start: 2014-04-10, 16:34:07===============================================
16:34:07:   Multithreaded optimizations: On
16:34:07:   Base resolution: 1600x900
16:34:07:   Output resolution: 1280x720
16:34:07: ------------------------------------------
16:34:07: Loading up D3D10 on AMD Radeon HD 7900 Series (Adapter 1)...
16:34:07: ------------------------------------------
16:34:07: Audio Format: 48000 Hz
16:34:07: ------------------------------------------
16:34:07: Audio Channels: 2 Ch
16:34:07: Playback device {0.0.0.00000000}.{926fc2a5-b03e-4906-9270-5219e7c13fa0}
16:34:07: ------------------------------------------
16:34:07: Using desktop audio input: Speakers (Logitech Wireless Headset)
16:34:07: ------------------------------------------
16:34:07: Using auxilary audio input: Microphone (Logitech Wireless Headset)
16:34:07: ------------------------------------------
16:34:07: Audio Encoding: AAC
16:34:07:     bitrate: 128
16:34:07: Using text output
16:34:07: Using graphics capture
16:34:07: Scene buffering time set to 400
16:34:07: ------------------------------------------
16:34:07: Video Encoding: x264
16:34:07:     fps: 30
16:34:07:     width: 1280, height: 720
16:34:07:     preset: veryfast
16:34:07:     profile: main
16:34:07:     keyint: 60
16:34:07:     CBR: yes
16:34:07:     CFR: yes
16:34:07:     max bitrate: 3500
16:34:07:     buffer size: 3500
16:34:07: ------------------------------------------
16:34:07: SharedTexCapture hooked
16:34:08: Using RTMP service: Twitch / Justin.tv
16:34:08:   Server selection: rtmp://live.justin.tv/app
16:34:08:   Interface: Realtek PCIe GBE Family Controller (ethernet, 100 mbps)
16:34:09: Completed handshake with rtmp://live.justin.tv/app in 139 ms.
16:34:09: SO_SNDBUF was at 65536
16:34:09: SO_SNDBUF is now 65536
16:34:10: RTMPPublisher::SocketLoop: Increasing send buffer to ISB 131072 (buffer: 17037 / 463872)
16:34:13: RTMPPublisher::SocketLoop: Increasing send buffer to ISB 262144 (buffer: 0 / 463872)
16:34:22: RTMPPublisher::SocketLoop: Increasing send buffer to ISB 524288 (buffer: 0 / 463872)
16:35:56: RTMPPublisher::SocketLoop: Increasing send buffer to ISB 1048576 (buffer: 0 / 463872)
16:37:17: No Intel graphics adapter visible in QSVHelper.exe, Optimus problem?
16:37:17: Failed loading CUDA dll
16:38:46: Total frames encoded: 8358, total frames duplicated: 0 (0.00%)
16:38:46: Total frames rendered: 8363, number of late frames: 1 (0.01%) (it's okay for some frames to be late)
16:38:46: RTMPPublisher::SocketLoop: Graceful loop exit
16:38:46: Average send payload: 6366 bytes, average send interval: 14 ms
16:38:46: Number of times waited to send: 0, Waited for a total of 0 bytes
16:38:46: Number of b-frames dropped: 0 (0%), Number of p-frames dropped: 0 (0%), Total 0 (0%)
16:38:46: Number of bytes sent: 125696927
16:38:46:
16:38:46: Profiler time results:
16:38:46:
16:38:46: ==============================================================
16:38:46: video thread frame - [100%] [avg time: 0.625 ms] [children: 40.3%] [unaccounted: 59.7%]
16:38:46: | scene->Preprocess - [0.64%] [avg time: 0.004 ms]
16:38:46: | GPU download and conversion - [39.7%] [avg time: 0.248 ms] [children: 36.6%] [unaccounted: 3.04%]
16:38:46: | | flush - [33.4%] [avg time: 0.209 ms]
16:38:46: | | CopyResource - [2.24%] [avg time: 0.014 ms]
16:38:46: | | conversion to 4:2:0 - [0.96%] [avg time: 0.006 ms]
16:38:46: Convert444Threads - [100%] [avg time: 0.622 ms] [children: 98.9%] [unaccounted: 1.13%]
16:38:46: | Convert444toNV12 - [98.9%] [avg time: 0.615 ms]
16:38:46: encoder thread frame - [100%] [avg time: 1.469 ms] [children: 5.45%] [unaccounted: 94.6%]
16:38:46: | sending stuff out - [5.45%] [avg time: 0.08 ms]
16:38:46: ==============================================================
16:38:46:
16:38:46:
16:38:46: Profiler CPU results:
16:38:46:
16:38:46: ==============================================================
16:38:46: video thread frame - [cpu time: avg 0.099 ms, total 828.125 ms] [avg calls per frame: 1]
16:38:46: | scene->Preprocess - [cpu time: avg 0.001 ms, total 15.625 ms] [avg calls per frame: 1]
16:38:46: | GPU download and conversion - [cpu time: avg 0.029 ms, total 250 ms] [avg calls per frame: 1]
16:38:46: | | flush - [cpu time: avg 0.026 ms, total 218.75 ms] [avg calls per frame: 1]
16:38:46: | | CopyResource - [cpu time: avg 0.001 ms, total 15.625 ms] [avg calls per frame: 1]
16:38:46: | | conversion to 4:2:0 - [cpu time: avg 0 ms, total 0 ms] [avg calls per frame: 1]
16:38:46: Convert444Threads - [cpu time: avg 0.463 ms, total 7734.38 ms] [avg calls per frame: 2]
16:38:46: | Convert444toNV12 - [cpu time: avg 0.458 ms, total 7656.25 ms] [avg calls per frame: 2]
16:38:46: encoder thread frame - [cpu time: avg 1.23 ms, total 10265.6 ms] [avg calls per frame: 1]
16:38:46: | sending stuff out - [cpu time: avg 0.136 ms, total 1140.63 ms] [avg calls per frame: 1]
16:38:46: ==============================================================
16:38:46:
16:38:46: =====Stream End: 2014-04-10, 16:38:46=================================================

Video Demonstration:
 
Last edited by a moderator:
Lain

Forum Admin
Lain
Forum Moderator
Developer
That wasn't a full log file. Anyway, according to what little info that was available in that portion in the log file, there doesn't seem to actually be a problem on OBS' end, each frame in OBS is drawing at a very nice 99 microseconds per frame. That's actually incredibly good performance. It's definitely not an issue with rendering or capturing at this point.

The encoder isn't running very high settings for your computer either, so I feel like something else on your computer might be 'interfering' on your computer at this point, and is causing this to happen somehow. I don't actually come to this sort of theory often, but I really cannot help but feel something else is going on at this point.
 

BananaMan396

New Member
Code:
06:03:55: Open Broadcaster Software v0.613b - 64bit ( ^ω^)
06:03:55: -------------------------------
06:03:55: CPU Name: AMD FX(tm)-8350 Eight-Core Processor
06:03:55: CPU Speed: 3991MHz
06:03:55: Physical Memory:  8171MB Total, 5378MB Free
06:03:55: stepping id: 0, model 2, family 21, type 0, extmodel 0, extfamily 3, HTT 1, logical cores 8, total cores 4
06:03:55: monitor 1: pos={0, 0}, size={1600, 900}
06:03:55: Windows Version: 6.2 Build 9200
06:03:55: Aero is Enabled
06:03:55: -------------------------------
06:03:55: OBS Modules:
06:03:55: Base Address     Module
06:03:55: 000000007AEB0000 OBS.exe
06:03:55: 00000000E4930000 OBSApi.dll
06:03:55: 00000000F0EA0000 DShowPlugin.dll
06:03:55: 00000000F0E70000 GraphicsCapture.dll
06:03:55: 00000000F12E0000 NoiseGate.dll
06:03:55: 00000000F0E50000 PSVPlugin.dll
06:03:55: ------------------------------------------
06:03:55: Adapter 1
06:03:55:   Video Adapter: AMD Radeon HD 7900 Series
06:03:55:   Video Adapter Dedicated Video Memory: 3202392064
06:03:55:   Video Adapter Shared System Memory: 4026531840
06:03:55:   Video Adapter Output 1: pos={0, 0}, size={1600, 900}, attached=true
06:03:55: =====Stream Start: 2014-04-11, 06:03:55===============================================
06:03:55:   Multithreaded optimizations: On
06:03:55:   Base resolution: 1600x900
06:03:55:   Output resolution: 1280x720
06:03:55: ------------------------------------------
06:03:55: Loading up D3D10 on AMD Radeon HD 7900 Series (Adapter 1)...
06:03:56: ------------------------------------------
06:03:56: Audio Format: 48000 Hz
06:03:56: ------------------------------------------
06:03:56: Audio Channels: 2 Ch
06:03:56: Playback device {0.0.0.00000000}.{926fc2a5-b03e-4906-9270-5219e7c13fa0}
06:03:56: ------------------------------------------
06:03:56: Using desktop audio input: Speakers (Logitech Wireless Headset)
06:03:56: ------------------------------------------
06:03:56: Using auxilary audio input: Microphone (Logitech Wireless Headset)
06:03:56: ------------------------------------------
06:03:56: Audio Encoding: AAC
06:03:56:     bitrate: 128
06:03:56: Using text output
06:03:56: Using graphics capture
06:03:56: Scene buffering time set to 400
06:03:56: ------------------------------------------
06:03:56: Video Encoding: x264
06:03:56:     fps: 30
06:03:56:     width: 1280, height: 720
06:03:56:     preset: veryfast
06:03:56:     profile: main
06:03:56:     keyint: 60
06:03:56:     CBR: yes
06:03:56:     CFR: yes
06:03:56:     max bitrate: 3500
06:03:56:     buffer size: 3500
06:03:56: ------------------------------------------
06:03:56: SharedTexCapture hooked
06:03:58: Using RTMP service: Twitch / Justin.tv
06:03:58:   Server selection: rtmp://live.justin.tv/app
06:03:58:   Interface: Realtek PCIe GBE Family Controller (ethernet, 100 mbps)
06:03:58: Completed handshake with rtmp://live.justin.tv/app in 154 ms.
06:03:58: SO_SNDBUF was at 65536
06:03:58: SO_SNDBUF is now 65536
06:04:00: RTMPPublisher::SocketLoop: Increasing send buffer to ISB 131072 (buffer: 19650 / 463872)
06:04:02: RTMPPublisher::SocketLoop: Increasing send buffer to ISB 262144 (buffer: 0 / 463872)
06:04:04: RTMPPublisher::SocketLoop: Increasing send buffer to ISB 524288 (buffer: 0 / 463872)
06:12:36: Total frames encoded: 15608, total frames duplicated: 0 (0.00%)
06:12:36: Total frames rendered: 15611, number of late frames: 1 (0.01%) (it's okay for some frames to be late)
06:12:37: RTMPPublisher::SocketLoop: Graceful loop exit
06:12:37: Average send payload: 6860 bytes, average send interval: 15 ms
06:12:37: Number of times waited to send: 0, Waited for a total of 0 bytes
06:12:37: Number of b-frames dropped: 0 (0%), Number of p-frames dropped: 0 (0%), Total 0 (0%)
06:12:37: Number of bytes sent: 235011030
06:12:37:
06:12:37: Profiler time results:
06:12:37:
06:12:37: ==============================================================
06:12:37: video thread frame - [100%] [avg time: 0.646 ms] [children: 23.7%] [unaccounted: 76.3%]
06:12:37: | scene->Preprocess - [0.929%] [avg time: 0.006 ms]
06:12:37: | GPU download and conversion - [22.8%] [avg time: 0.147 ms] [children: 20%] [unaccounted: 2.79%]
06:12:37: | | flush - [17.3%] [avg time: 0.112 ms]
06:12:37: | | CopyResource - [1.86%] [avg time: 0.012 ms]
06:12:37: | | conversion to 4:2:0 - [0.774%] [avg time: 0.005 ms]
06:12:37: Convert444Threads - [100%] [avg time: 0.642 ms] [children: 99.1%] [unaccounted: 0.935%]
06:12:37: | Convert444toNV12 - [99.1%] [avg time: 0.636 ms]
06:12:37: encoder thread frame - [100%] [avg time: 1.225 ms] [children: 7.27%] [unaccounted: 92.7%]
06:12:37: | sending stuff out - [7.27%] [avg time: 0.089 ms]
06:12:37: ==============================================================
06:12:37:
06:12:37:
06:12:37: Profiler CPU results:
06:12:37:
06:12:37: ==============================================================
06:12:37: video thread frame - [cpu time: avg 0.03 ms, total 468.75 ms] [avg calls per frame: 1]
06:12:37: | scene->Preprocess - [cpu time: avg 0.001 ms, total 15.625 ms] [avg calls per frame: 1]
06:12:37: | GPU download and conversion - [cpu time: avg 0.003 ms, total 46.875 ms] [avg calls per frame: 1]
06:12:37: | | flush - [cpu time: avg 0.003 ms, total 46.875 ms] [avg calls per frame: 1]
06:12:37: | | CopyResource - [cpu time: avg 0 ms, total 0 ms] [avg calls per frame: 1]
06:12:37: | | conversion to 4:2:0 - [cpu time: avg 0 ms, total 0 ms] [avg calls per frame: 1]
06:12:37: Convert444Threads - [cpu time: avg 0.832 ms, total 25984.4 ms] [avg calls per frame: 2]
06:12:37: | Convert444toNV12 - [cpu time: avg 0.826 ms, total 25796.9 ms] [avg calls per frame: 2]
06:12:37: encoder thread frame - [cpu time: avg 0.925 ms, total 14437.5 ms] [avg calls per frame: 1]
06:12:37: | sending stuff out - [cpu time: avg 0.139 ms, total 2171.88 ms] [avg calls per frame: 1]
06:12:37: ==============================================================
06:12:37:
06:12:37: =====Stream End: 2014-04-11, 06:12:37=================================================


I ran the same test and got the full log file. It was running smooth for about 10 minutes and it started doing the same thing again. I am not sure if it could be a overheating problem perhaps? I am not sure what the problem is.
 

Jack0r

The Helping Squad
It can definitely be an overheating problem. We recently had two other guys with an AMD FX-8*** series CPU but just stock cooling. The cpu, if I remember correct, started to clock itself down because it got too hot.
Streaming while gaming is very intensive and definitely needs a good cooling. So check your temperatures and cpu clocks etc, while doing another test.
 

BananaMan396

New Member
Log File:
http://pastebin.com/VqqcRXBY

Here are the results. I played League of Legends instead of CoD4 but I would assume similar results.I displayed the cpu and gpu temps in the video while playing. The dip happens a little after 4:30 minutes into the video. Are my temps fine? If not, what can I do perhaps to improve my temps. I am not using stock cooler by the way. I am using an aftermarket.

Cooler:
http://www.newegg.com/Product/Product.aspx?Item=N82E16835233081
 
Last edited:

Jack0r

The Helping Squad
Hmm, the video is private for me :/
Anyway, the cooler looks ok. What temperatures did you get, and remember, the cpu clock speed/timings are also important!
 

Jack0r

The Helping Squad
Hmm, you can clearly see that the CPU Vcore is going down the moment the lag starts. From 1,352V to 0,8V and as soon as the lag stops, back to 1,352V.
The temperatures overall do not look too high, but if the CPU clocks itself down, it would probably explain your problems.
 

vbdkv

Member
Classic sign of VRM throttling. That board specifically requires active VRM cooling when using an 8 core CPU - However since you are using a tower cooler, it doesn't help much (if any) to actively cool the VRM and that results in throttling to lower the temperature.

A simple test you can do; Aim a fan directly at the VRM and see if it still overheats.

I have a different board (M5A99X Evo R2.0) which has a beefier heatsink, however I still opted for the NH-D14 cooler as it can actively cool the VRM as well with it's middle fan that sticks out at the bottom - It doesn't take a huge amount of air to cool the VRM.


In case you don't know where the VRM is located, I found this pic
http://i50.tinypic.com/3309y8m.jpg
 
Last edited:
for that amount of money you could get a closed loop h100i.
heat pipe technology is great, but the pipes are meant to be installed where the pipes are vertical not horizontal like all towers would place them in. this causes them to not be as effective.

to explain this, the pipes have a liquid in them that boils at a low temp. then that vapor rises, gets cooled, then drops back down as a liquid. if placed in horizontal, the liquid doesn't really drop back down to the cpu as its intended.

liquid cooling would do a lot better of a job and with less fan noise/rpm.

another feature to help you out. search up "Disable CPU Throttling in Windows" via google
 

vbdkv

Member
So if I were to get, as you suggested, the "NH-DL4 cooler", would it solve my problem?
I would highly recommend that you do a little testing before buying a high end cooler such as the NH-D14. Simply aim a fan directly at the VRM, use tape if you have to, and see if it's still throttling. If no throttling occurs, then you do indeed need active VRM cooling which the NH-D14 provides.
 
How exactly is that going to help cool the VRM? If anything it'll be even worse than the cooler he has now. CPU temps will drop, sure, but that's not the problem he's having.
Without knowing what motherboard he actually has, neither will the NH-DL4.
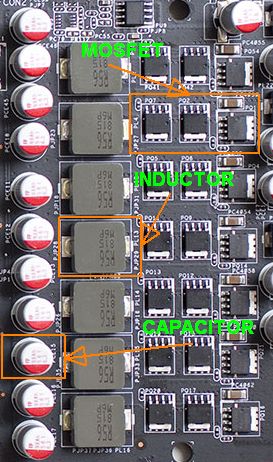
your picture is Part of what is called the VRM. you've got mosfets, inductors, and capacitors that make up the VRM. neither the inductors or capacitors need any type of cooling. only the mosfets.
in your image, the mosfets are under the heatsink circled in red.
if he has a heatsink on his mosfets then either that isn't the problem or his motherboard is about to fry due to faulty mosfet or voltage being controlled by either the PSU or motherboard.

The OP would really need to post what motherboard he has to determine if this is the issue or not. if he doesn't have a heatsink on his mosfets, then sure, they could be overheating, however he should buy a heatsink for them.
this is a picture of a graphics card VRM but its identical to the VRM for the CPU, at least when it comes to the parts that make them up.
asus_eah_5830_vrm_details.jpg


you can either look at your motherboard and find the brand and model or can install cpuid ftp://ftp.cpuid.com/cpu-z/cpu-z_1.69-setup-en.exe to find out what the motherboard make and model is.
 

BananaMan396

New Member
Solved the issue. I went into BIOS and disabled Turbo core as it, from what I noticed, made my CPU clock from around 3.8 GHZ to around 4.3 GHZ and made the CPU overheat and throttle. Right now Turbo core is disabled and I noticed that the max my cpu will go to is around 54 degrees Celsius and noticed no performance issues.Thanks for the help guys.
 
Last edited:
Top